PX Long Range Test Errors
Cache View
Model Cache Flushing
Small Flush Per-write
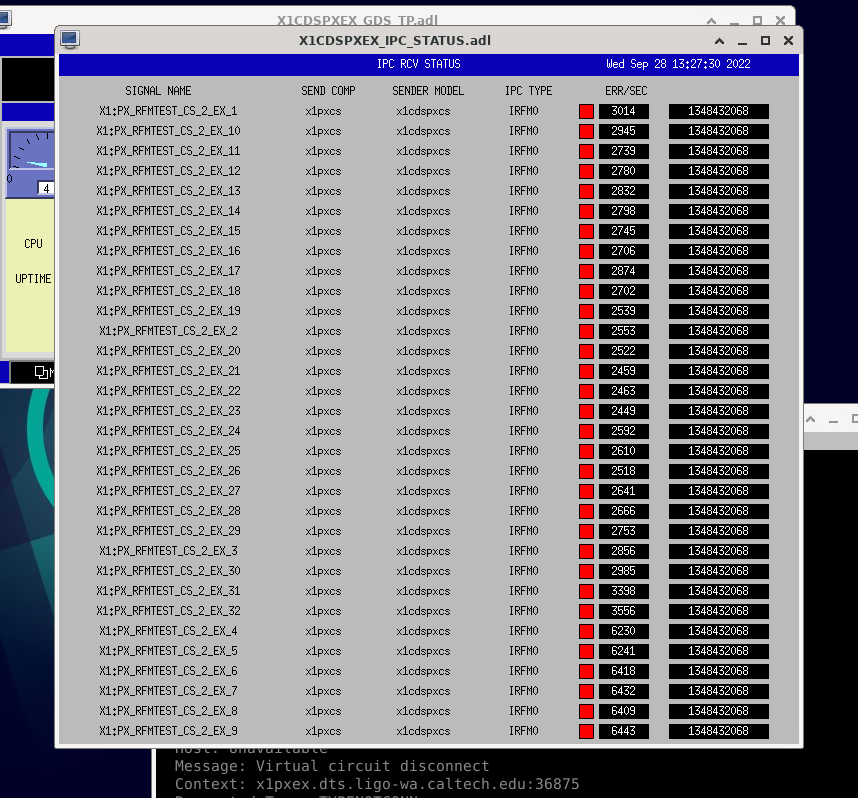
Models run slower (expected) ~7 us. Error rate is distributed over the IPCs (both sides[ex/cs]) higher IPCs are better (some with no errors) lower IPCs have more errors, some have ALL errors. Ex have small error counts on top ~0-35.
One Large Flush
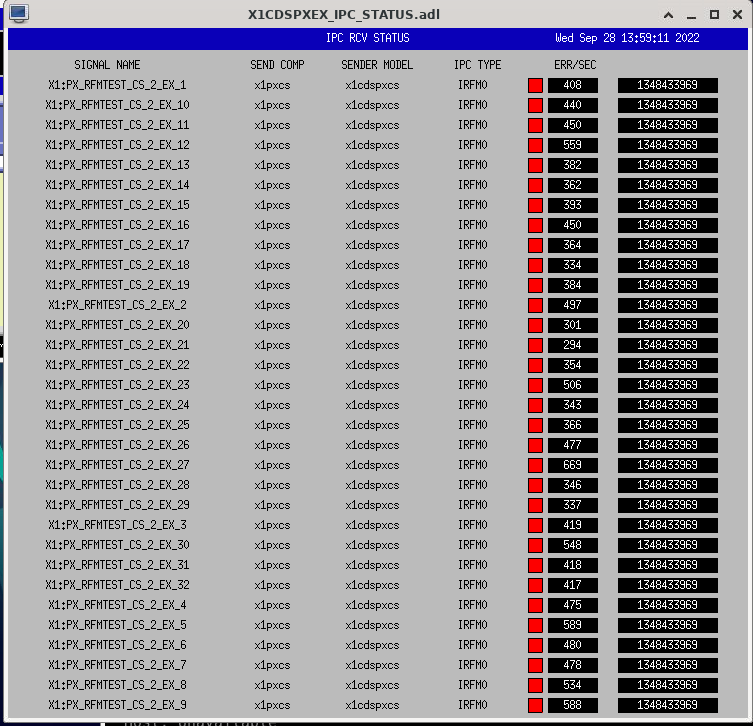
Models run faster ~4us. Error rate is spread over all IPCs. It is somehow higher than no model flush.
RFM Cache Flushing
Legacy Partial Flush (at end)
RFM Timing: (T0 ~6us, T1 ~2.5 us)
Optimized Loop and Legacy Partial Flush
RFM Timing: (T0 ~3.3us, T1 ~2.5 us)
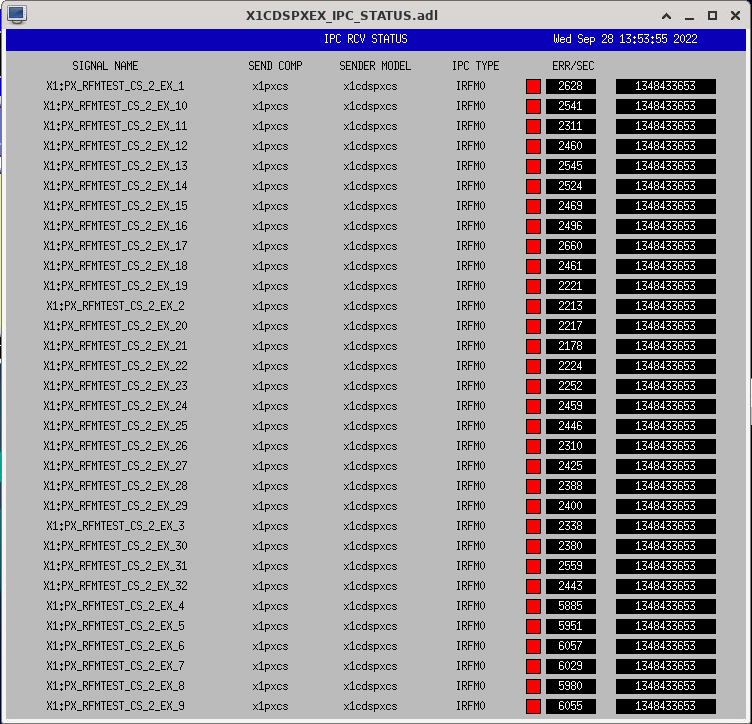
Flush Each Write
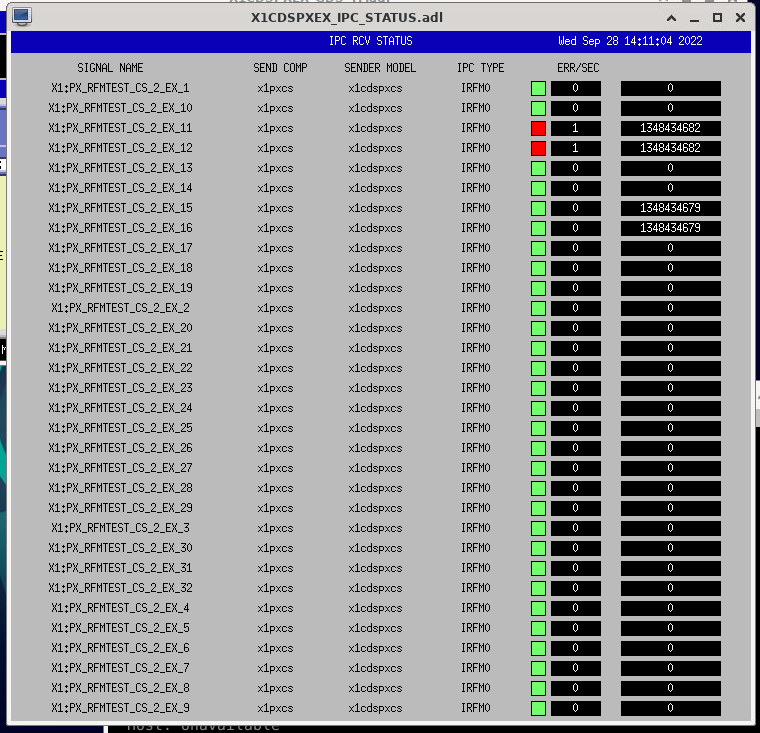
This does allow us to run 16 IPCs per model with no errors, but 32 IPCs look like higher error rates than no flush. RFM Timing: (T0 ~5.8us, T1 ~6 us)
Optimized Loop and Flush Each Write
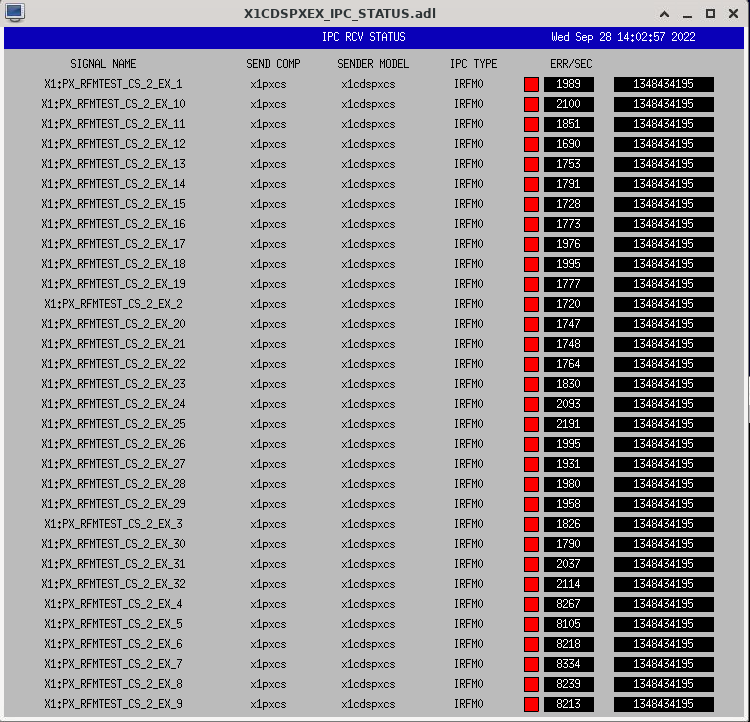
Error rate looks better in 32-><-32 setup than with just the flush.
Edited by Ezekiel Dohmen